
Projects / Reference
Global Mission Map
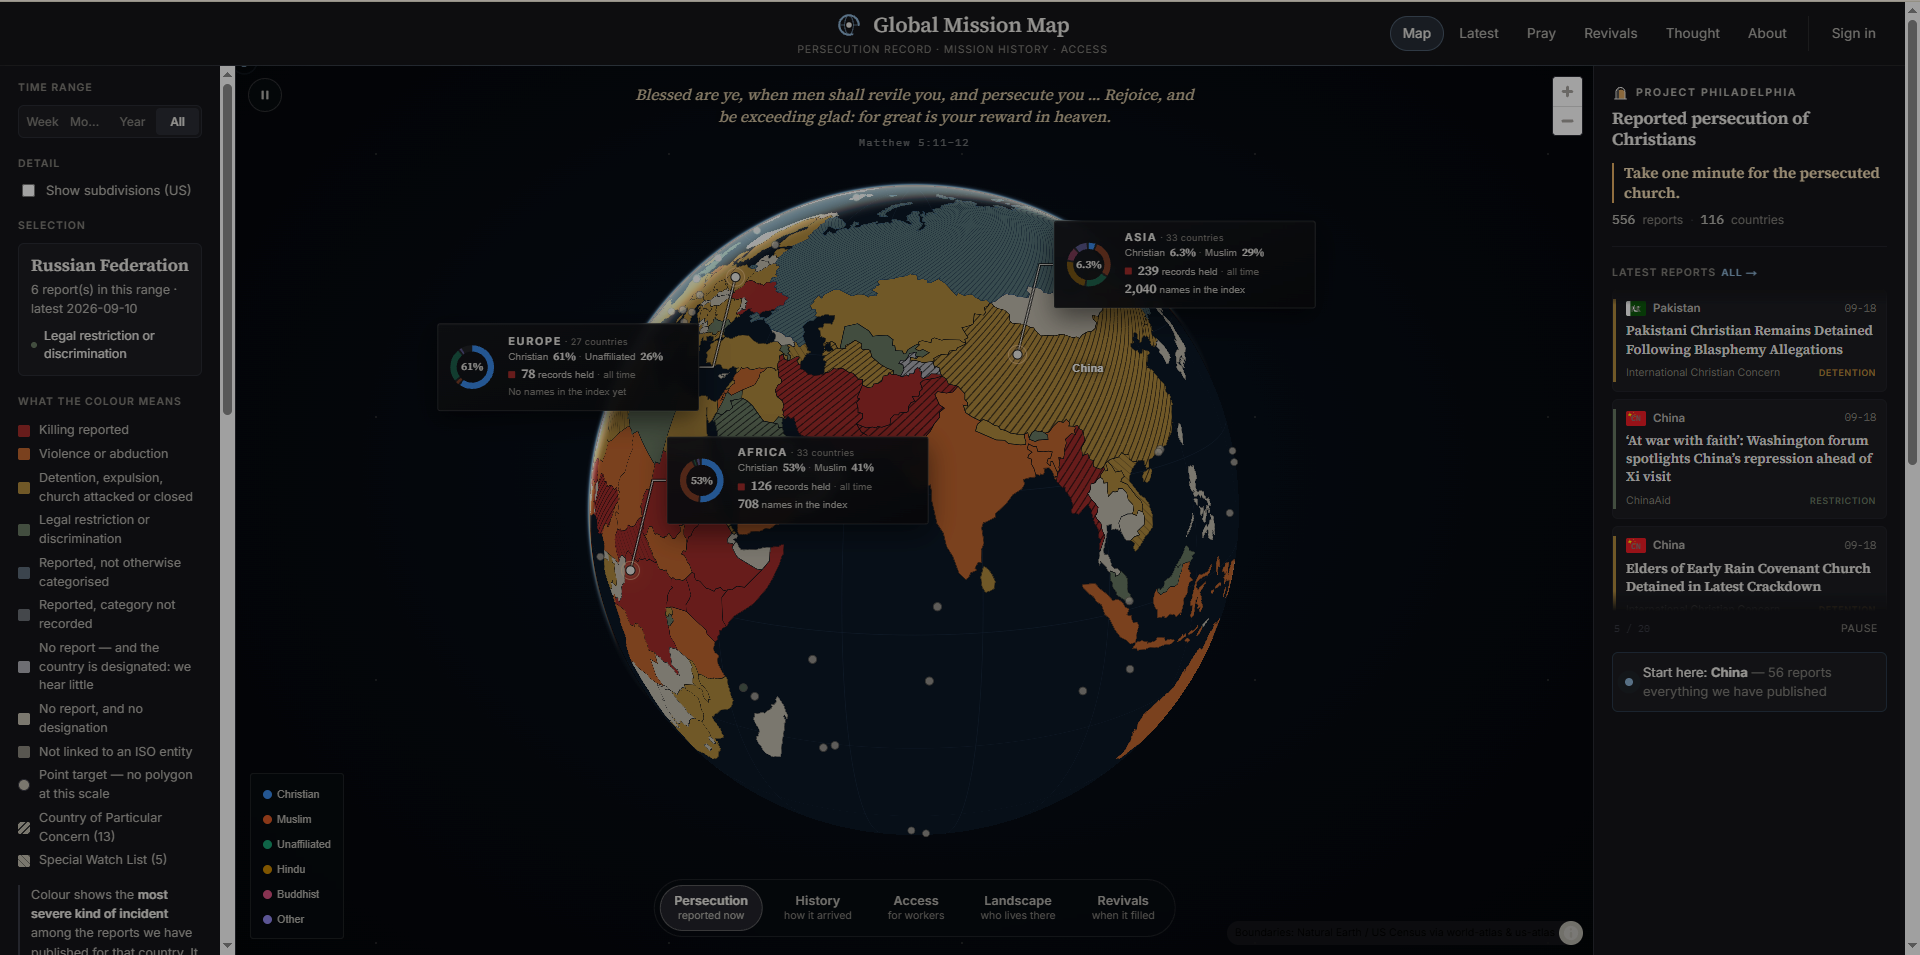
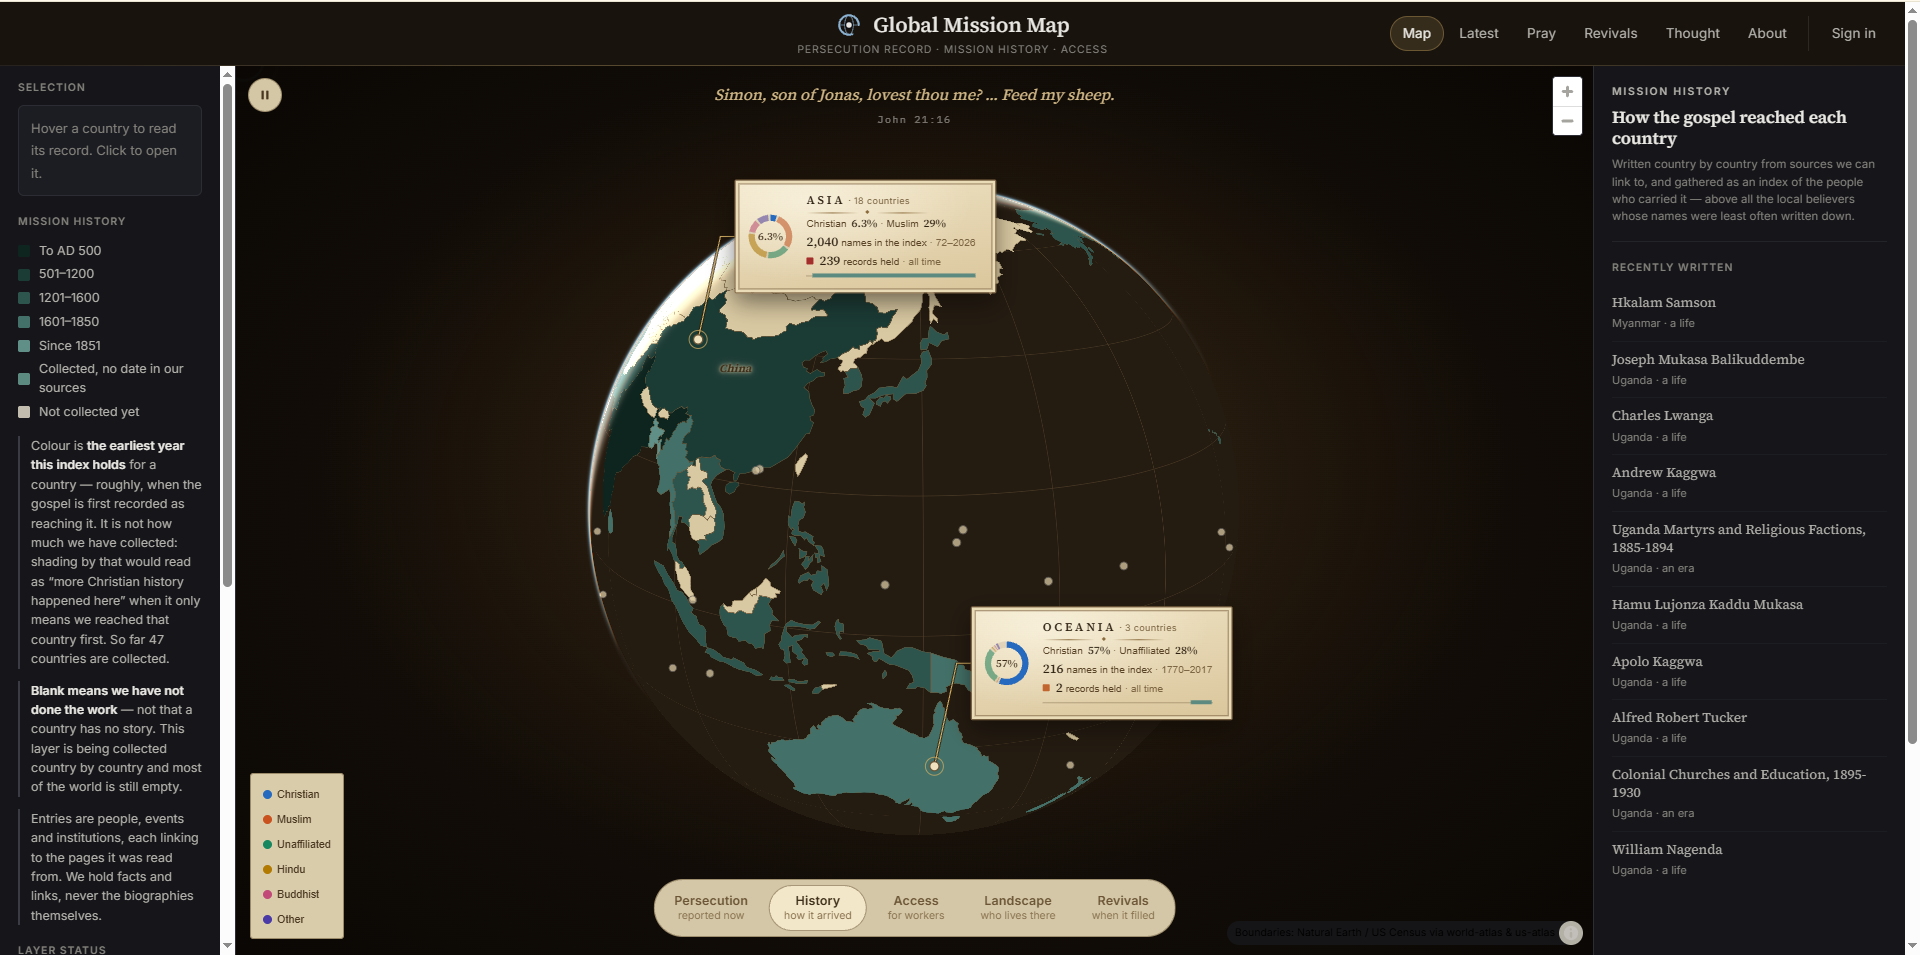
The Christian church on one world map: reported persecution, mission history and mission access, country by country, each report linked to the publisher that reported it.
Screenshots
About this project
SAMPLE PROJECT / REFERENCE IMPLEMENTATION. Built by the course developer before the term to prove this submission path works. Not student work.
A map, and an archive behind it. Each country carries what has been published about the church there - reports of persecution with a date and a source, how the gospel arrived, what access workers have now, who lives there - and the map is coloured by the most severe kind of incident among the reports held for that country.
What makes it worth reading as an example is what it refuses to do. The colour is not a risk score and not a count of victims, and the page says so. Countries that restrict reporting produce the fewest reports, so the places hardest to hear from would otherwise look the safest: the two greys are different - one says an outside authority has made a finding and we hold nothing, the other says nobody has - and neither is a clean bill of health. The hatching marks the designations of a government, dated and attributed, and the page is explicit that the judgement is not the map's own. Every headline links out to the publisher; no article bodies and no photographs are held, and nothing is claimed to have been verified.
It is reference project H: a full database-backed web application - Next.js, Postgres, an ingestion pipeline, a map rendered from public boundary data - and the showcase's worked example of a submission for something that already lives at an address of its own.
Problem and purpose
Reports of persecution are scattered across many publishers and vanish quickly. Gathering them on a map makes them findable - and makes it far too easy to imply things the reports do not support, which is the harder half of the problem and the part this project spends most of its care on.
Intended users
Anyone praying for the persecuted church, and students looking at what it takes to publish a claim about the world responsibly.
Major features
- A world map coloured by the most severe kind of incident reported in each country, with the scale explained in plain words
- Every report dated, categorised and linked to the publisher that reported it
- Silence shown as silence: two different greys for 'no report and a designation exists' and 'no report and no designation'
- Persecution, history, access, landscape and revivals as five readings of the same country
- Small states drawn as reachable circles rather than dropped from the outline
- Time range filters, subdivisions for the United States, and a searchable index of everything held
Known limitations
The archive is of what has been published and reached this collection, not of what happens. A country with no reports is a gap in reach before it is anything about the country, and the map says so rather than letting the colour imply otherwise.
Nothing here is independently verified: the record is that a named publisher reported something on a date, and the link is there so a reader can go and see. Categories are assigned from the report's own wording, which is a judgement, and the counts are of reports rather than of incidents or of people.
How it is built
Three layers that do not know much about each other: an ingestion pipeline that collects published reports and stores them with their source and date; a database that holds reports, countries and the joins between them; and a map that reads only what has been published. The map never computes a score - it reads the most severe category present, which is why the legend can be written in one sentence.
Who built it
-
Dr. Taegil Ha
Author (reference implementation)
Wrote the project as the course's worked example of this submission path.